
The Graph price has been in a deep downward trend in the past few months and is currently trading near the lowest point on record. GRT, its native token, is trading at $0.3250, which is about 76% below the highest level on record.
Why has GRT dropped?
The Graph is a sophisticated blockchain project that plays an important role in the decentralized industry. It provides solutions that are used by thousands of developers every day.
The project offers APIs which help developers to query thousands of codes every day. This is an important feature since most blockchains are open-source platforms that rely on developers from around the world.
By using The Graph, blockchain companies are able to skip the expensive process of setting up their own custom servers. They are able to query the vast decentralized data using The Graph.
While The Graph was initially built to support Ethereum, the developers have expanded the service by making it compatible with other networks. Some of those platforms are Polygon, NEAR, BNB Chain, MoonRiver, and Fantom among others.
The Graph’s network has three key services. First, there is The Graph Studio, which enables developers to use, build subgraphs, and API keys. This is the most important that the platform offers. Second, there is The Graph Explorer, which lets people explore subgraphs and interact with the network. And finally, it has a hosted service that lets people create subgraphs.
The Graph price has crashed sharply in the past few months because of the ongoing performance of the cryptocurrencies industry. Another possible reason is that many people who are not developers are not able to understand its role in the decentralized industry.
Further, the fact that central banks are considering tightening monetary policy has also pushed more people out of risky assets.
The Graph price prediction
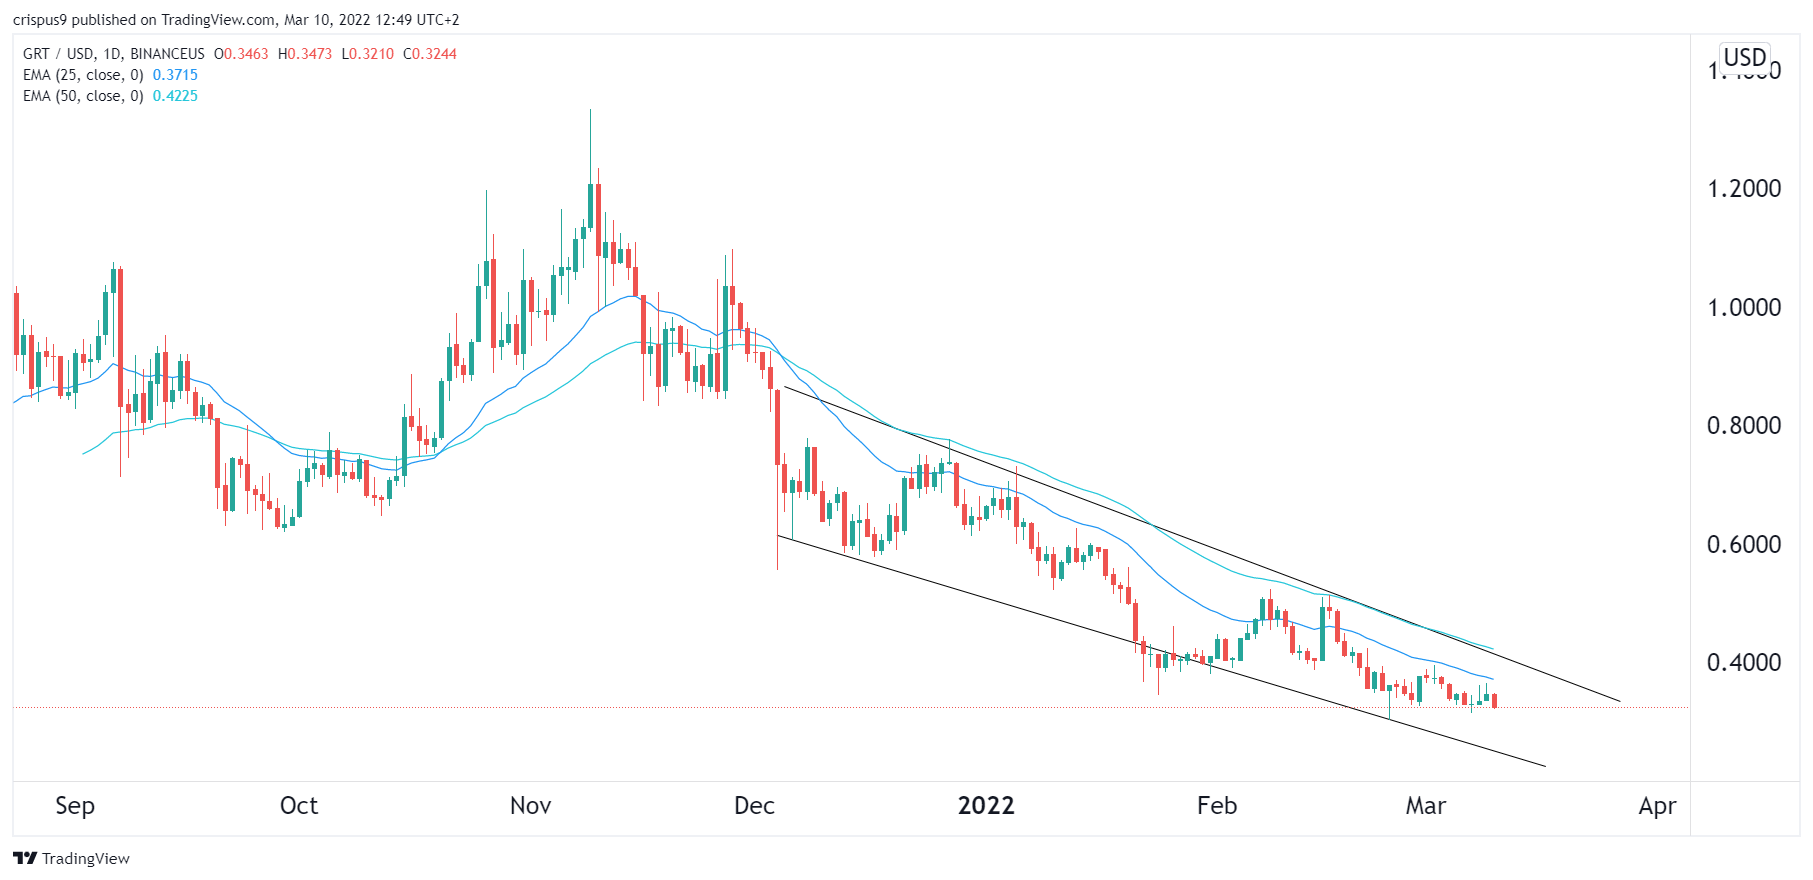
The daily chart shows that The Graph price has been in a strong bearish trend in the past few months and is currently trading near its all-time low. At the same time, the coin has moved below the 25-day and 50-day moving averages.
GRT has also dropped and formed a descending channel that is shown in black. Indeed, the price is currently between the descending channel.
Therefore, there is a likelihood that the coin will continue falling as bears target the next key support level at $0.25. On the flip side, a move above the resistance level at $0.40 will invalidate the bearish view.