
Harmony price has made a strong pullback in the past few days as investors worry about its ecosystem and the extremely hawkish Federal Reserve. ONE, its native token is trading at $0.1440, which is the lowest it has been since March 25th this year. The price has crashed by over 21% from its highest level this week.
Why has the Harmony price fallen?
Harmony is a fast-growing blockchain platform that aims to be a leading place for developers to build their decentralized applications.
It is a platform that uses Byzantine Fault Tolerance (BFT) and sharding technologies to ensure that developers are able to build fast and low-cost applications. It is a fully scalable platform that has embraced cross-sharding technology. It also uses the RaptorQ fountain code that helps to propagate blocks quickly.
Harmony price has done well in the past few months as more developers have embraced its network. According to DeFi Llama, some of the top developers in the ecosystem are DeFi Kingdoms, Tranquil Finance, and ViperSwap. Other cross-chain apps using Harmony are Curve, SushiSwap, and StakerDAO.
Like other platforms, Harmony has also launched a developer grant worth $300 million. These funds will be distributed to developers building DEFI, NFT, and gaming apps in its ecosystem. Harmony has a Vision 2026 that seeks to scale web 3 through zero-knowledge rollups and decentralized autonomous organizations.
The Harmony price is falling sharply as investors react to the sharp decline of the network's Total Value Locked (TVL). The TVL currently stands at $738 million, which is lower than its all-time high of $1.38 billion. In the past 7 days, DeFi Kingdoms and Tranquil Finance TVL has dropped by 24.47% and 5%, respectively. Similarly, the TVL of ViperSwap and FarmersOnly has dropped by more than 20%.
Harmony price prediction
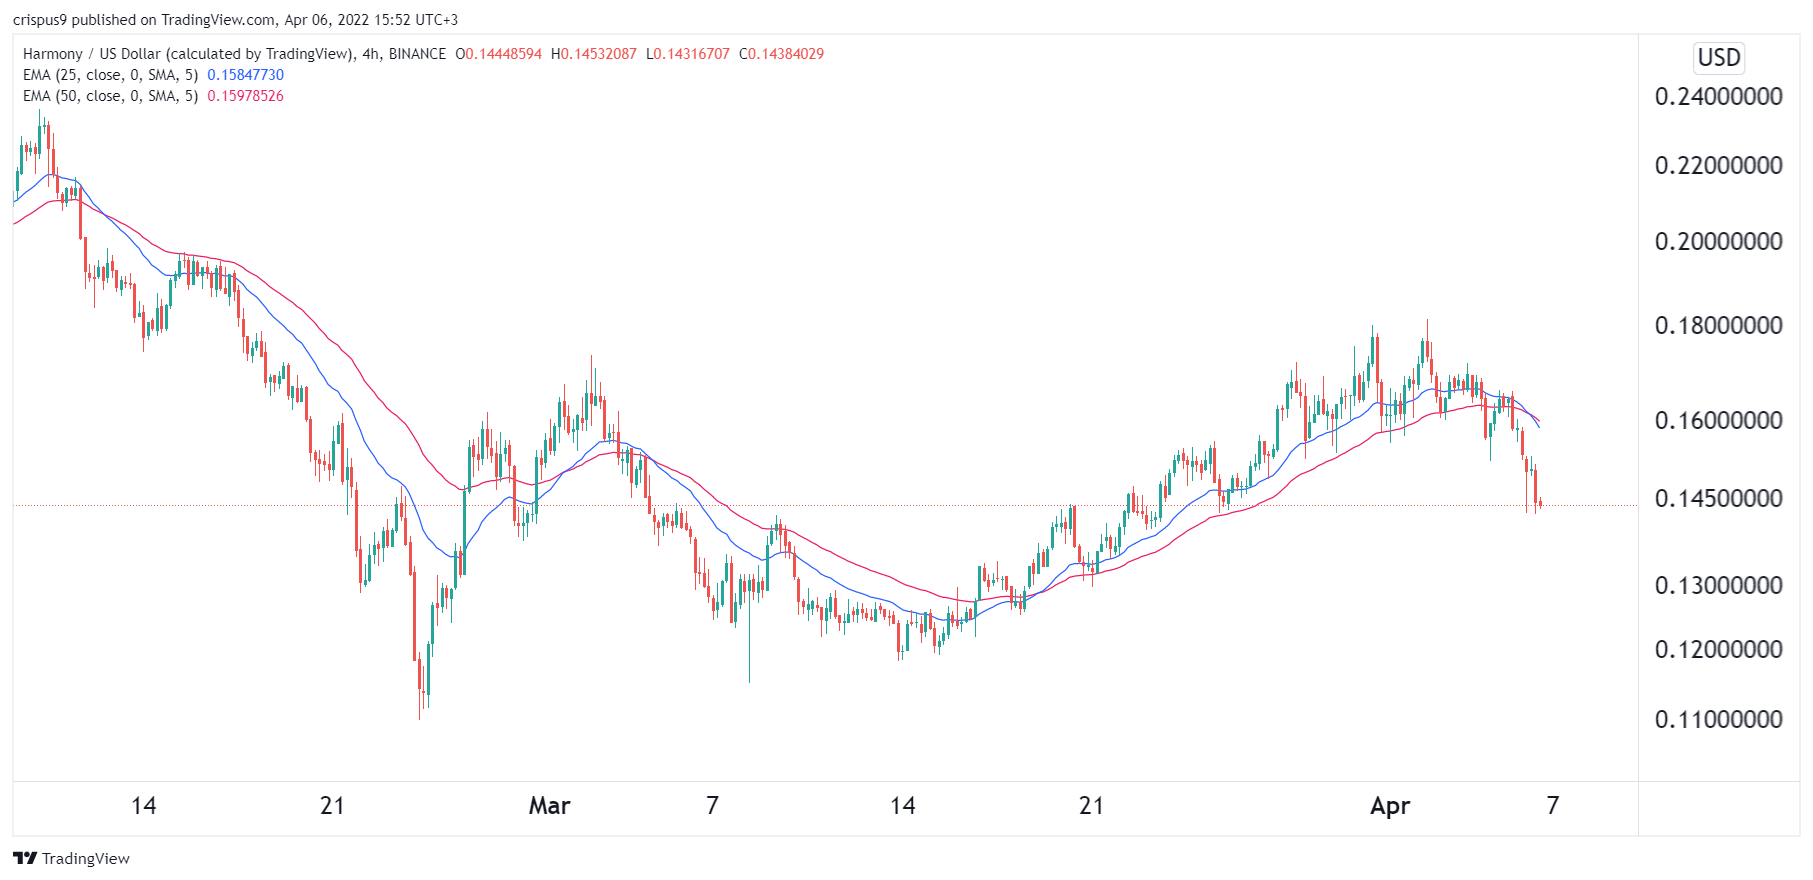
The daily chart shows that the Harmony price has been in a strong bearish trend in the past few days. This decline started when it formed a double-top pattern at about $0.18. In technical analysis, a double top is usually a bearish sign. The 25-day and 50-day moving averages have made a bearish crossover pattern.
Therefore, there is a likelihood that the ONE price will continue falling as bears target the next key support level at $0.13.