

Ethereum price is in a fresh consolidation mode as investors reflect on the recent spectacular comeback. It is also in a tight range as the market weighs the recent merge of the network as it transitions from a proof-of-work to a proof-of-stake platform. It is now trading at $3,520, which is slightly below last week’s high of $3,580. Its market cap has moved to about $423 billion.
ETH rally pauses
Ethereum has been in a spectacular rally in the past few weeks even as market risks have risen recently. For example, in the United States, the yield curve inverted and dropped to the lowest level since 2007. The curve inverts when the 10-year yield underperforms the 2-year and is usually a sign that a recession will happen in the coming months.
The war in Ukraine has continued even as Russia has started to retreat from Kiev. The country’s military intends to focus on eastern Ukraine, as western countries weigh more sanctions on the regime. There are worries that Russia will cut off its gas supplies to Europe, which will lead to a major crisis.
Meanwhile, Ethereum price is consolidating as signs point to greed among investors. The closely-watched fear and greed index has moved to 53, which is a sign of greed. This level is slightly below last week’s high of 56. Historically, a reading of 50 and above usually points to more upside. Warning signs emerge when it gets to the extreme greed zone of above 80.
ETH price has also been in a consolidation phase as investors wait for more updates on the transition from a proof-of-work to a proof-of-stake platform. In a recent note, the developers noted that the testing went smoothly in the Kiln network.
Ethereum price prediction
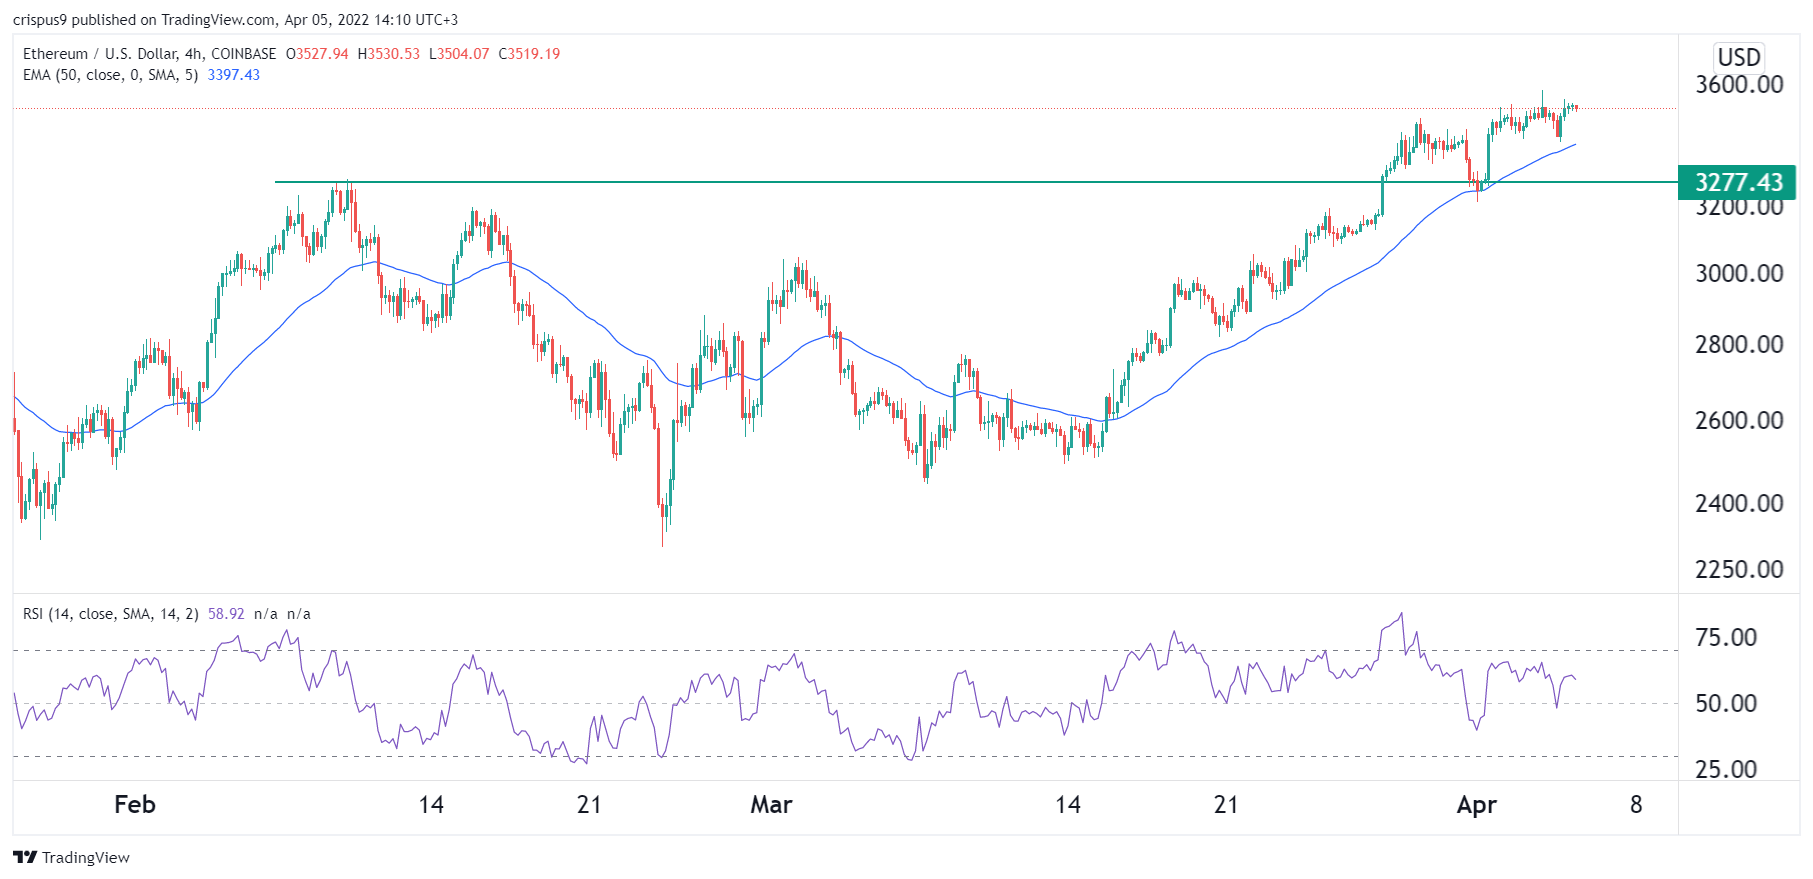
The four-hour chart shows that the ETH price managed to form a break and retest pattern. In this, the coin managed to retest the important support at $3,277, which was the highest point on February 10th this year. Historically, this pattern is usually a bullish sign.
The price has moved above the 50-day moving average, signaling that the bullish trend is still intact. The Relative Strength Index has moved to the neutral level of about 50. Therefore, there is a likelihood that the coin will maintain a bullish trend as bulls target the resistance at $3,800.