

The BNB price has been in a tight range in the past few months as concerns about the network’s ecosystem remains. It is trading at $378, where it has been in the past few days. The price has crashed by over 45% from the highest level in December last year.
BNB analysis
BNB is the native token for the BNB Chain, which was formerly known as Binance Smart Chain (BSc). It is a platform that helps developers build all types of decentralized applications (dApps) like those in the DeFi and NFT industries.
There are two main reasons why the BNB price has crashed in the past few months. First, there are concerns about the network’s ecosystem. In the past few months, it seems like BNB’s ecosystem is no longer vibrant as it used to be.
For example, the total value locked in its DeFi ecosystem has dropped to about $11 billion from a peak of over $30 billion a few months ago.
The likely reason for this is that it has been affected by other chains that are significantly faster and have better features. While BNB can handle less than 45 transactions per second, others like Elrond, Near, and Avalanche can process thousands in the same time.
Another possible reason is that the BNB Chain is known for its gaps in security. In the past few years, we have seen several projects in the network lose millions of dollars.
Second, like all other cryptocurrencies, the BNB price has declined sharply because of the ongoing fear of a hawkish Federal Reserve. The bank will conclude its monetary policy decision on Wednesday this week.
Analysts expect that the bank will deliver the first interest rate hike since 2018 in a bid to battle inflation. Historically, risky assets like BNB and Bitcoin tends to underperform in a high-interest rate environment.
BNB price prediction
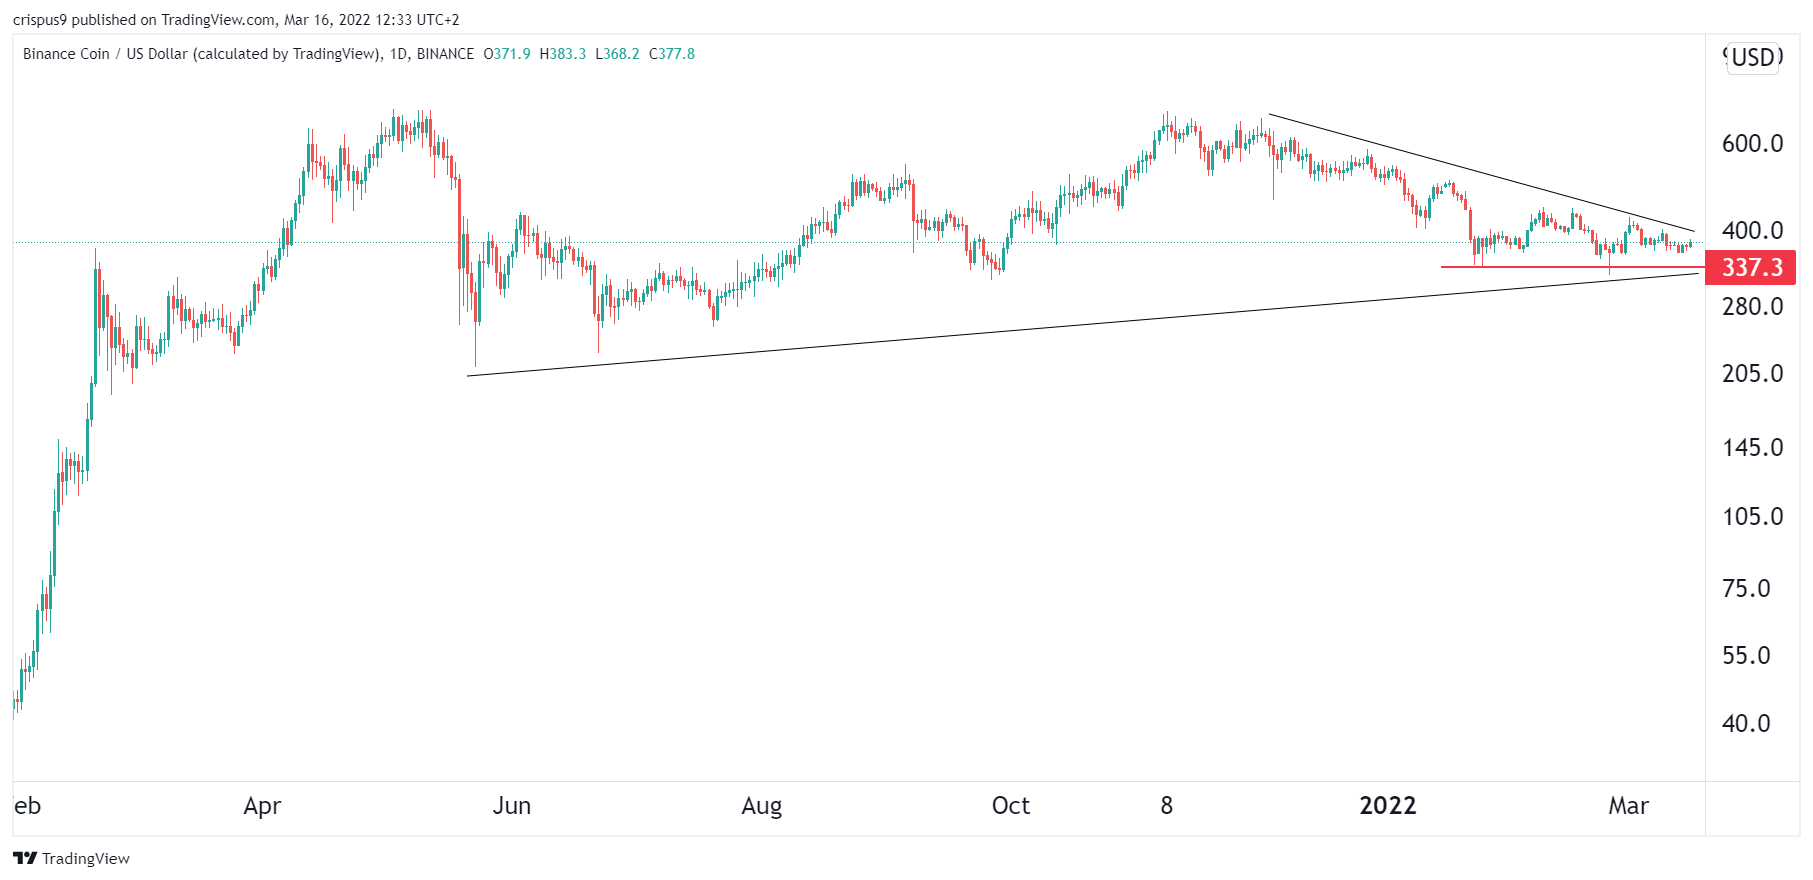
The daily chart shows that the BNB price has been moving sideways in the past few weeks. As a result, the coin is trading at the same point as the 25-day and 50-day exponential moving averages. It has also formed a triangle pattern that is shown in black.
A closer look at this triangle shows that it is nearing its confluence zone. Also, the BNB price has also formed strong support at $337. Therefore, this could be a sign that a breakout is about to happen. Therefore, there is a likelihood that it will bounce back higher this week.