

The Bitcoin price remarkable comeback has ended. The coin has dropped in the past three straight days and is trading at $41,384, which is about 8% below its highest level this week.
Fed and NFP data
The BTC price decline started on Wednesday when the Federal Reserve chair started his testimony in Congress. In it, he reiterated that the bank will likely start hiking interest rates this month. He hinted that the rate hike could be as much as 50 basis points.
He justified his statement by saying that the rate hike will be necessary because of the rising consumer prices. Data published by the US showed that inflation has surged to the highest level in more than 40 years. And the situation is set to worsen considering that oil and gas prices have continued in the past few months.
Historically, Bitcoin prices tends to underperform in a period of high-interest rates since investors rush to safe-havens.
The next key catalyst for the Bitcoin price will be the upcoming American jobs numbers scheduled for Friday. Analysts expect these numbers to show that the economy continued to add thousands of jobs in February as most states ended their Covid restrictions.
Precisely, analysts polled by Reuters expect the data to show that the economy added over 400k jobs in February after it added 467k in the previous month. At the same time, the unemployment rate is expected to have moved back below 4%.
The BTC price action also mirrored that of American equities. On Thursday, the Dow Jones, Nasdaq 100, and S&P 500 indices declined sharply as investors continued to worry about the state of the Russian economy amidst the current sanctions. Many western firms have announced that they will exit the country while the Russian ruble has collapsed.
Bitcoin price prediction
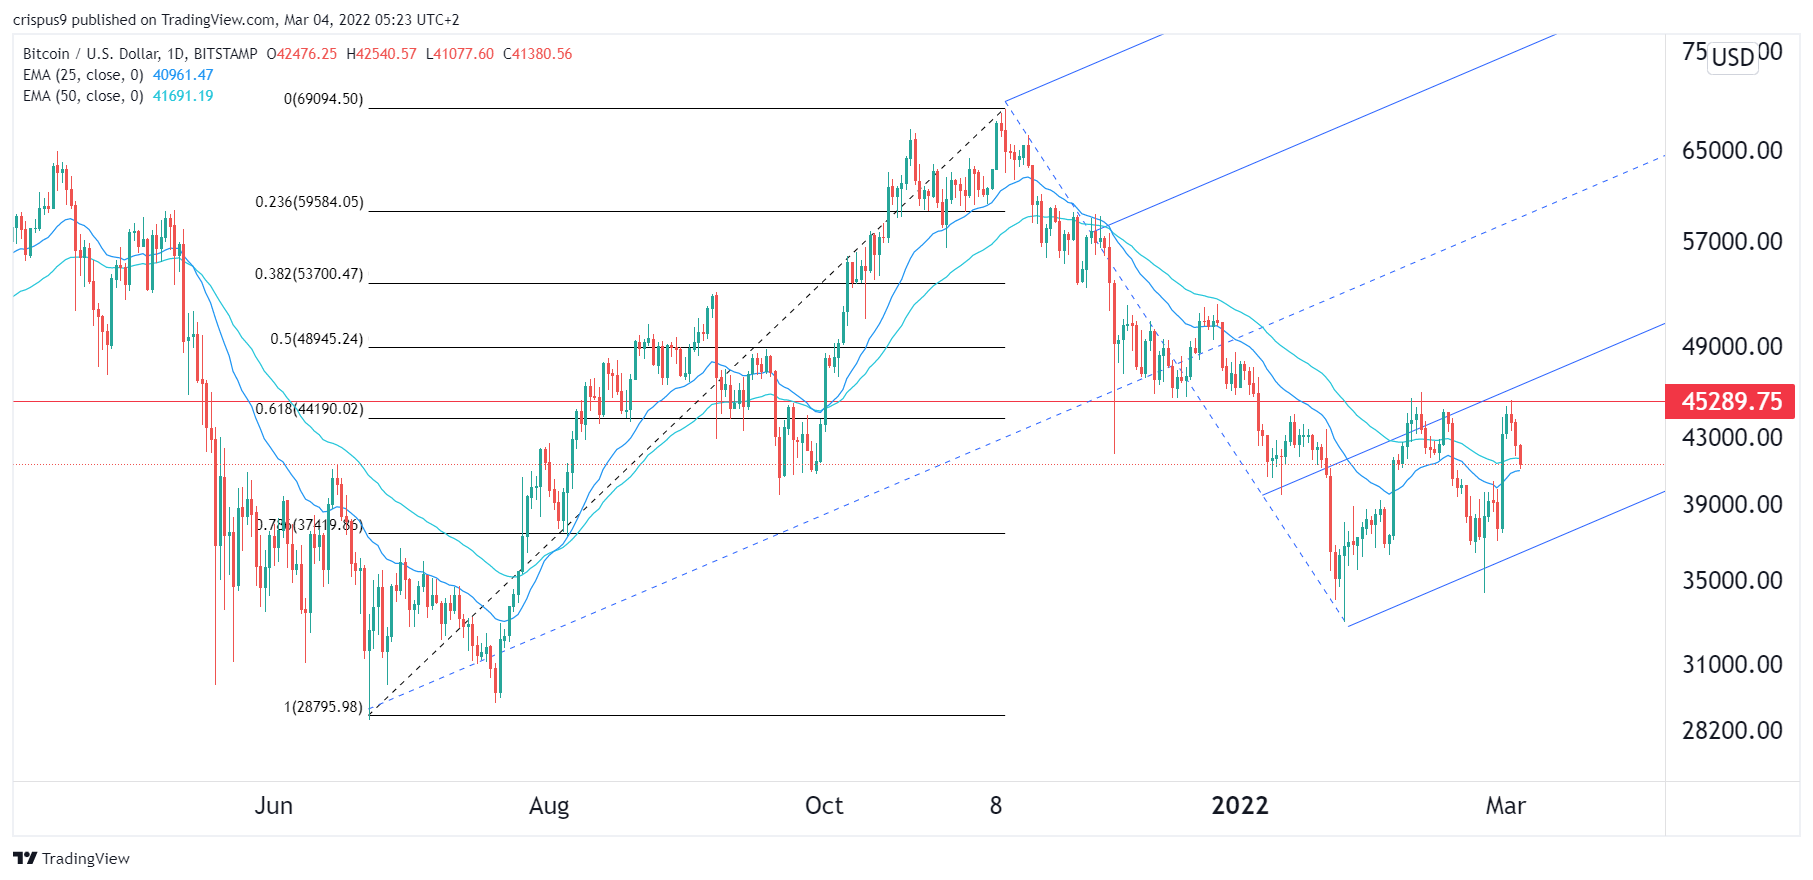
A closer look at the daily chart shows that the BTC price has formed a double-top pattern at around $45,290. This pattern is usually a bearish sign, which explains why it has been in a downward trend in the past three days.
The price is also slightly above the 25-day and 50-day moving averages and is slightly below the first support of the Andrews pitchfork tool. Also, it has moved below the 61.8% fibonacci retracement level.
Therefore, the path of the least resistance for Bitcoin price is lower, with the next key level to watch being at $40,000.